


Sample Size Survival - Hazard rate
Introduction
Prior to undertaking a research project it is essential to calculate how large your sample size should be to ensure it is adequately powered, to avoid a type II error. One method of achieving this calculation is through implementing a mechanism similar to a survival analysis.Survival analysis, also known as time-to-event analysis, is a branch of statistics concerned with analysing the expected time duration until a predetermined outcome. In biomedical research, this is the analytical approach of choice for randomised-controlled trials.
If you are looking to conduct a survival analysis, please use this page instead
If you are looking to estimate the required sample size for a survival analysis, please continue reading.
Description
This sample size calculator enables you to calculate the required sample for a fixed-design, two arm trial with time-to-event outcome. This is achieved through Group-sequential analysis, which calculates an optimal sample size value using the known values and their boundaries. For a more complete understanding of group sequential analysis please read Ed Berry’s excellent guide here [https://www.eddjberry.com/post/intro-group-sequential-designs]
This analysis should be undertaken in the planning stages of your study and to accurately use this calculator your design should:
- Compare a single treatment against a control
- Recruit patient and follow them over a set period of time (fixed design)
- Be looking to use time-to-event (Kaplein-Meier) analyses
Formatting and terms
You do not need to upload any statistics data to undertake this analysis. You will however need to know the predicted values for a number of terms, these should be derived from review of the literature.
For all calculations
- Ts: This is the duration of time (in months) that you plan to follow a patient up for after recruitment.
- Tr: This is the duration of time (in months) that you will recruit patients.
- Alpha value: The probability of Type I error.
- Beta value: The probability of Type II error.
If using Proportion surviving:
The proportions of survivors in groups 1 and group 2
If using Median survival time:
The median survival time in groups 1 and group 2
If using Hazard Rate:
You will need the failure rate in groups 1 and two respectively. These are described as Lambda 1 and Lambda 2.
Interpretation
Once you have entered the above values you may view the outputs, regardless to which option you select, the output is the same.
The output is organised as ‘Summary’, ‘Group Sequential’ and a number of plots.
- Summary: Describes the values used in the calculation.
- Group sequential: Describes the number of sequential analyses, number of events (N), the p value at each analysis and the upper and lower bounds.
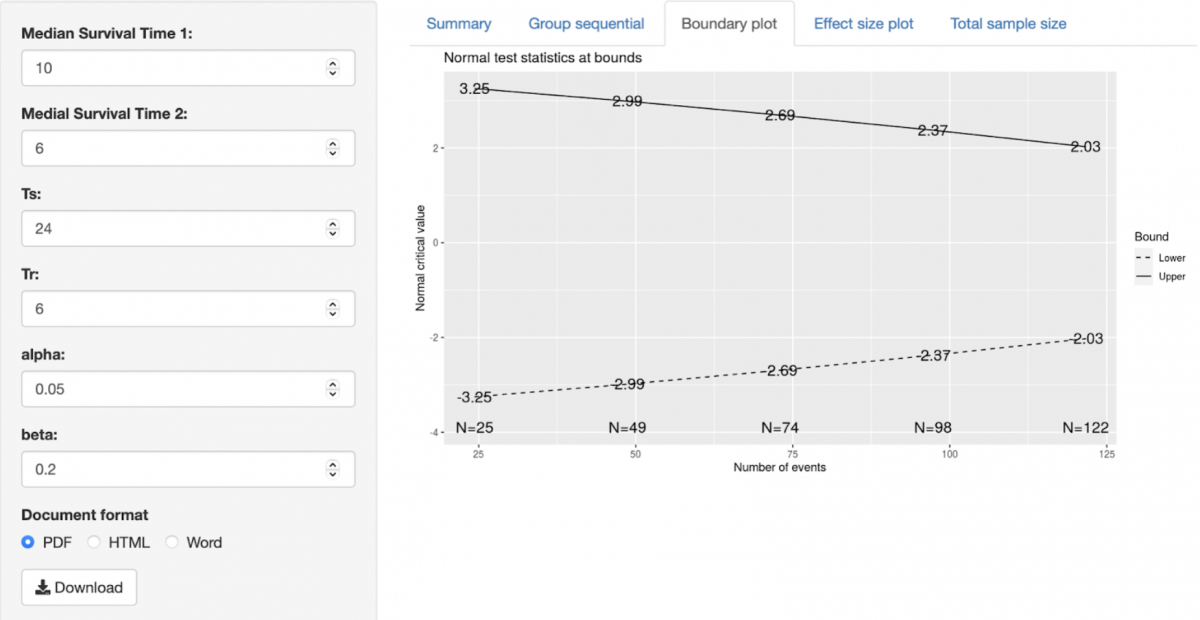
- Boundary plot: Displays the Z value boundaries at each sequential analysis
- Effect size plot: Displays the boundaries as a hazard ratio at each sequential analysis
- Total sample size: Gives the number of events and overall required sample size, you must scroll sideways to see all information.
Worked Example
I want to calculate my required sample size for a two-arm trial comparing medicine X against Control.
Medicine X is likely to have a median survival of 10 months whilst control only 6 months.
I will run my trial for 24 months and recruit for 6 months. I have selected conventional alpha values of 0.05 and beta value of 0.2.
I select Total Sample Size tab and my calculated required sample size is below:

Written by Daniel Richardson, Aneya Scott and Lorenzo Lenti
Resources
Survival Analysis Part I: Basic Concepts and first analyses
https://www.ncbi.nlm.nih.gov/pmc/articles/PMC2394262/
Introducing group sequential designs for early stopping of A/B tests
https://www.eddjberry.com/post/intro-group-sequential-designs/